Note
Go to the end to download the full example code.
Domain Decomposition Visualization#
Visualize how domain partitioning works for sliced vs cubic decompositions.
import matplotlib.pyplot as plt
import pyvista as pv
from pyvista import themes

from Poisson import DomainDecomposition, get_project_root
Setup#
pv.set_plot_theme(themes.ParaViewTheme())
pv.global_theme.anti_aliasing = "ssaa"
pv.global_theme.smooth_shading = True
pv.global_theme.multi_samples = 16

# Get paths using installed package utility (works in Sphinx-Gallery)
repo_root = get_project_root()
fig_dir = repo_root / "figures" / "decomposition"
fig_dir.mkdir(parents=True, exist_ok=True)

cmap = plt.cm.viridis
N = 32
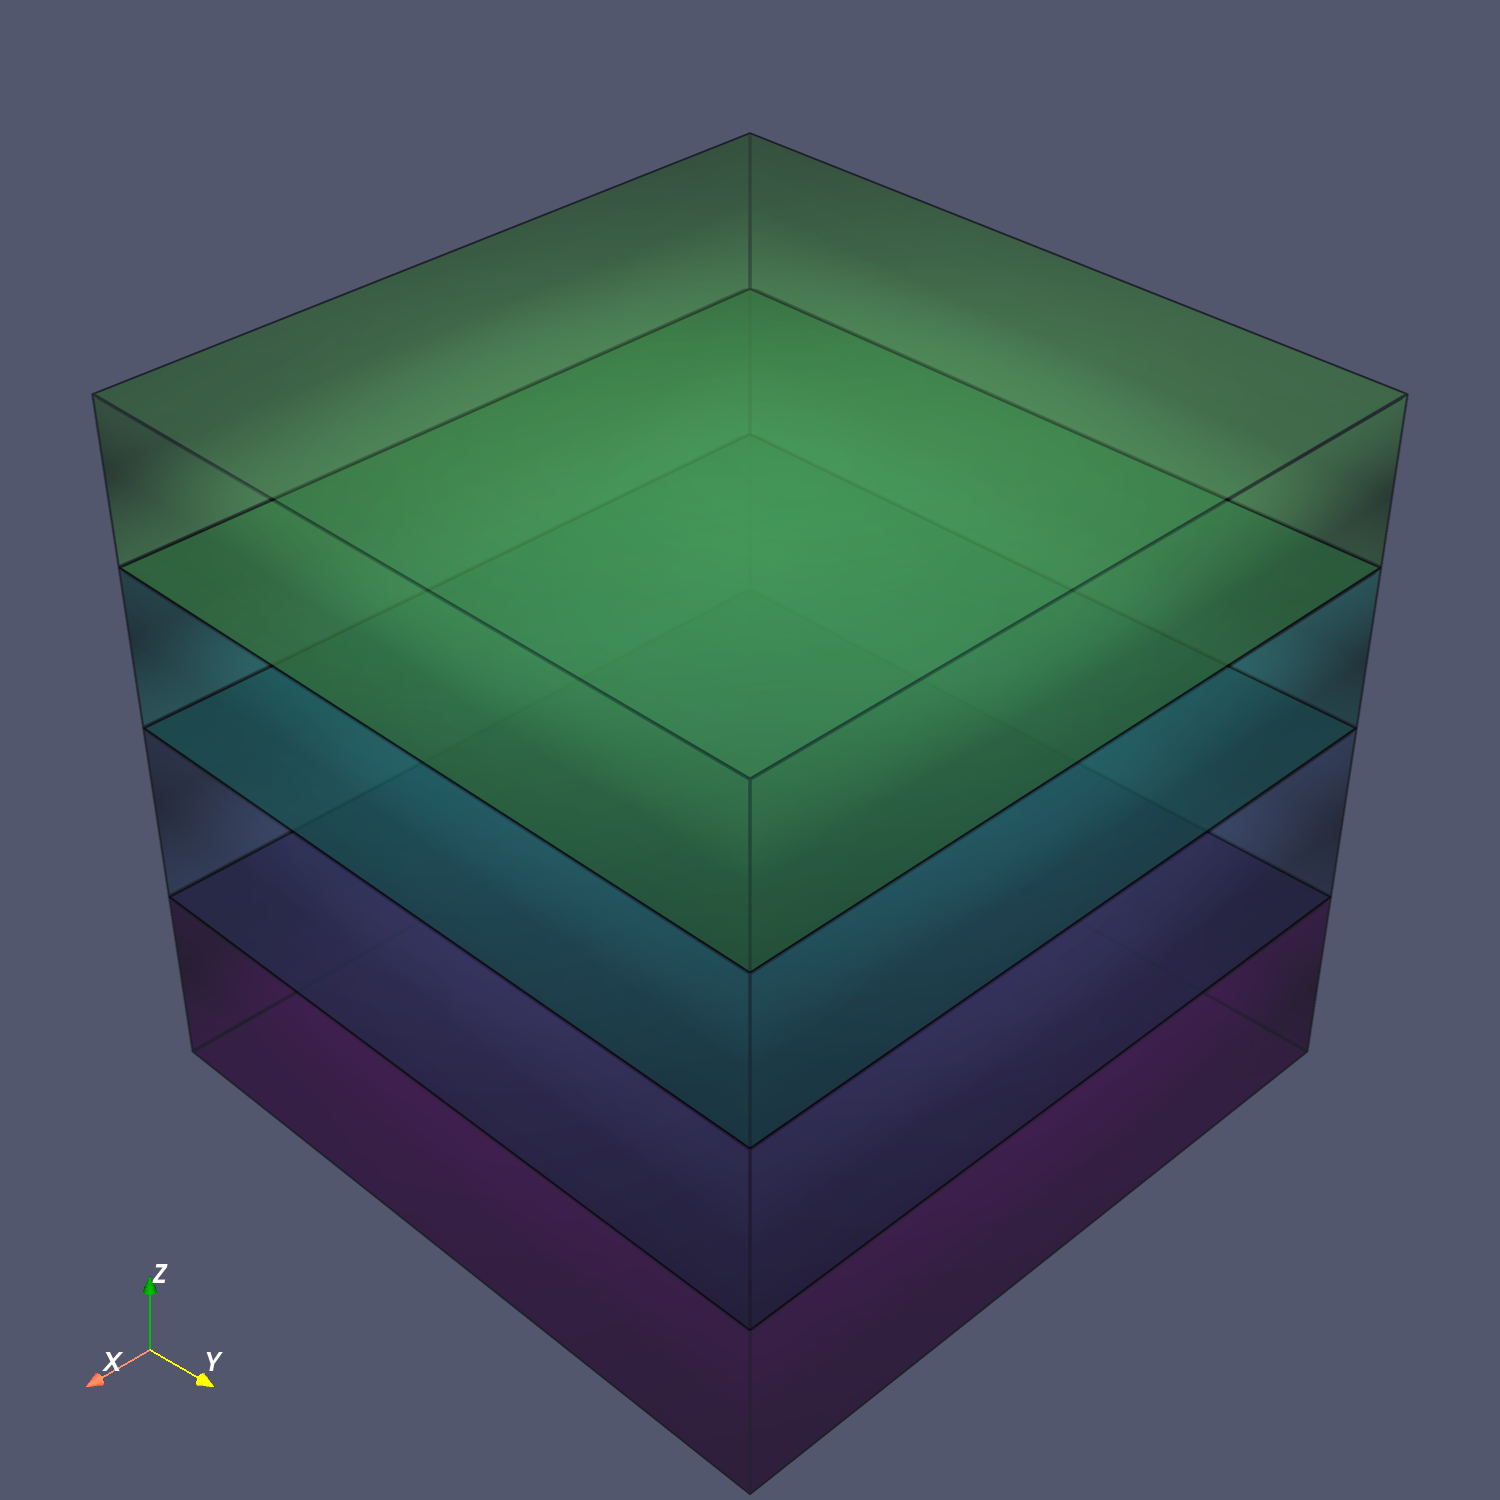
Sliced Decomposition (4 ranks)#
1D decomposition along Z-axis - each rank owns horizontal slices.
decomp = DomainDecomposition(N=N, size=4, strategy="sliced")
plotter = pv.Plotter(window_size=[1500, 1500], off_screen=True)

for rank in range(4):
    info = decomp.get_rank_info(rank)
    z0, y0, x0 = info.global_start
    z1, y1, x1 = info.global_end
    box = pv.Box(bounds=[x0, x1, y0, y1, z0, z1])
    color = cmap(rank / 4)[:3]
    plotter.add_mesh(
        box, opacity=0.4, color=color, show_edges=True, edge_color="black", line_width=8
    )

plotter.add_axes()
plotter.screenshot(
    fig_dir / "01a_sliced_decomposition.png", transparent_background=True
)
plotter.show()
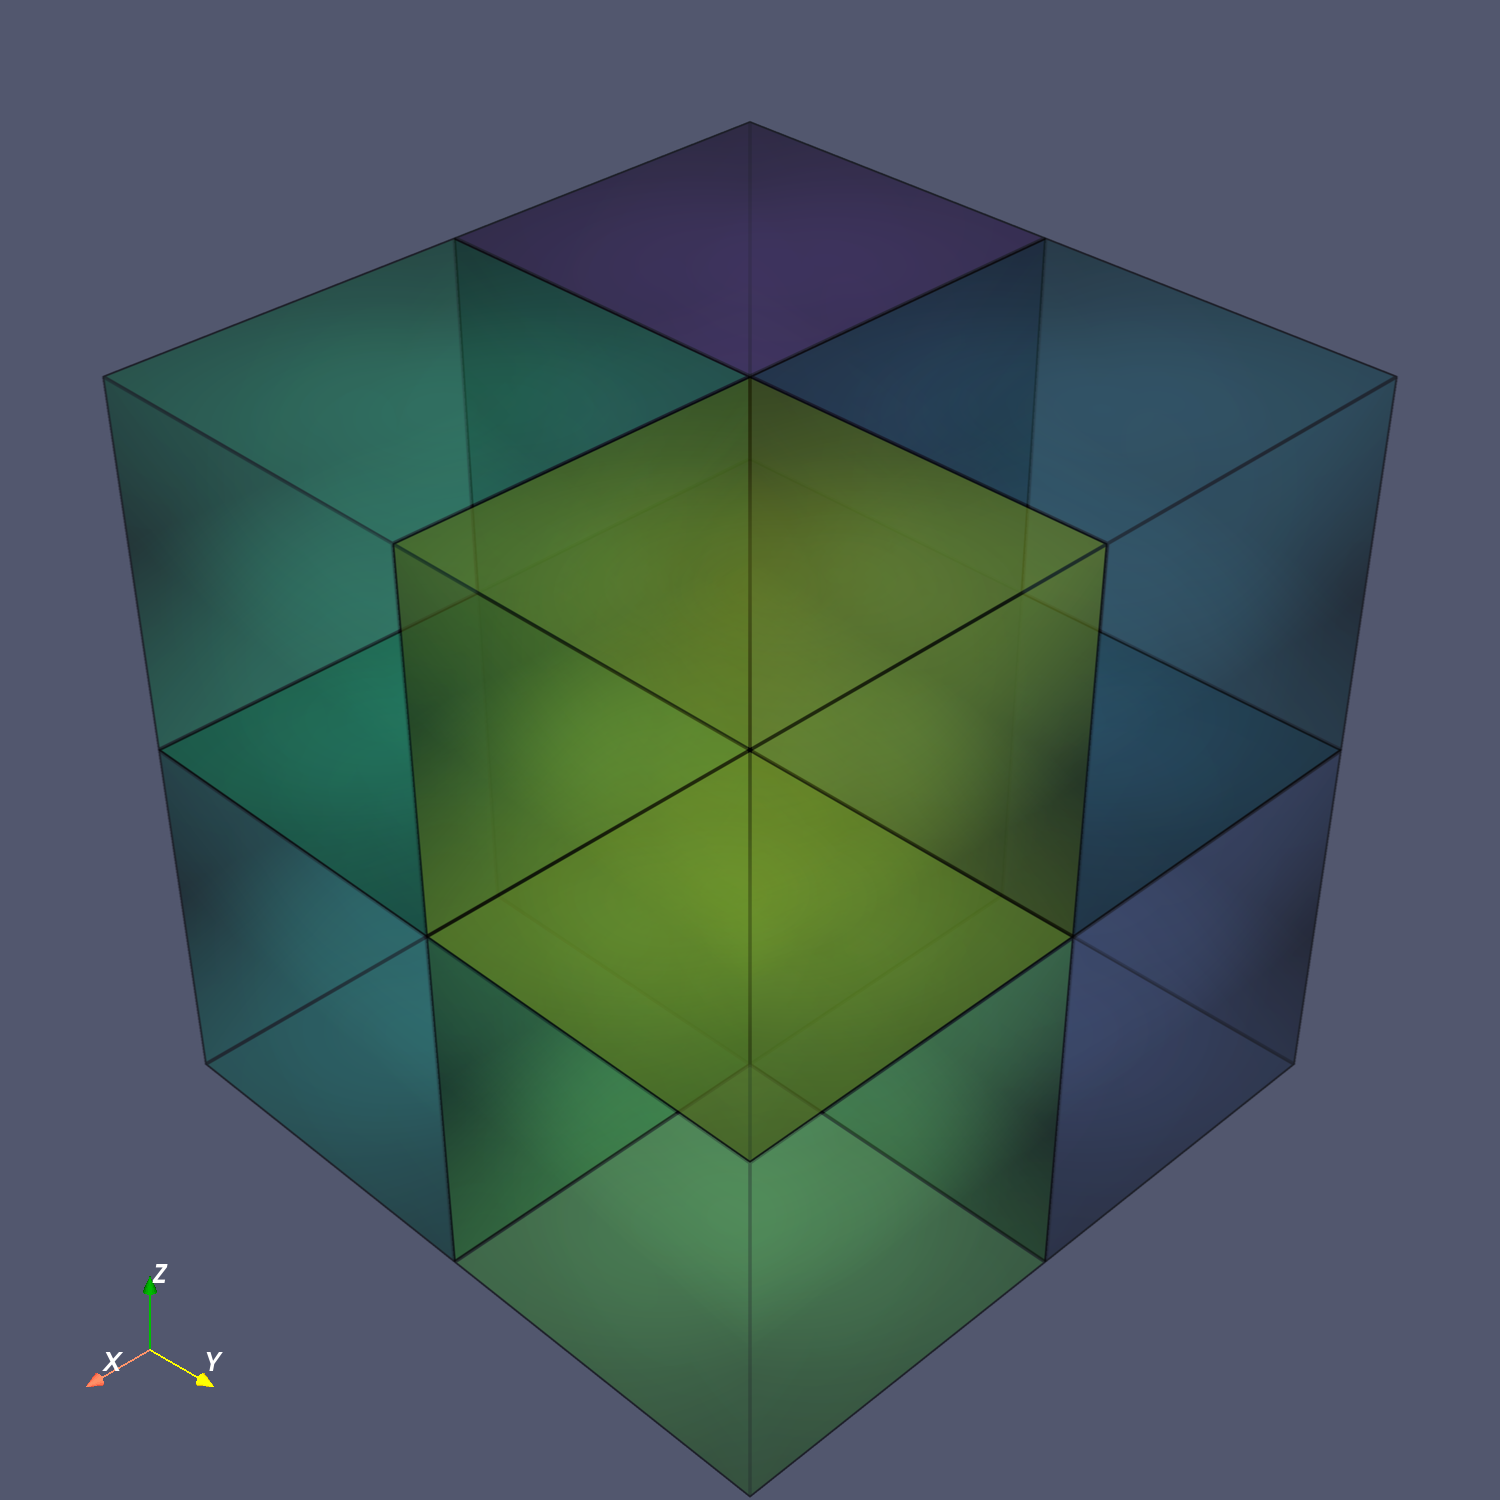
Cubic Decomposition (8 ranks)#
3D Cartesian decomposition - domain split across all dimensions.
decomp = DomainDecomposition(N=N, size=8, strategy="cubic")
plotter = pv.Plotter(window_size=[1500, 1500], off_screen=True)

for rank in range(8):
    info = decomp.get_rank_info(rank)
    z0, y0, x0 = info.global_start
    z1, y1, x1 = info.global_end
    box = pv.Box(bounds=[x0, x1, y0, y1, z0, z1])
    color = cmap(rank / 8)[:3]
    plotter.add_mesh(
        box, opacity=0.4, color=color, show_edges=True, edge_color="black", line_width=8
    )

plotter.add_axes()
plotter.screenshot(fig_dir / "01b_cubic_decomposition.png", transparent_background=True)
plotter.show()
Total running time of the script: (0 minutes 8.095 seconds)